Poppr 2.6.0: Better Network Plotting
By Zhian N. Kamvar in R example
January 11, 2018
Poppr version 2.6.0 has
officially been released on
CRAN and should be built for all
operating systems within the next few days 🎉. You can check
out the
NEWS for full details. This release features a new function called
boot.ia() to assess how the
Index of Association responds to repeat
observations (clones). Perhaps the biggest feature is the change in how minimum
spanning networks are plotted.
Minimum spanning networks were originally implemented in poppr by Javier Tabima and I, and since then they’ve gone through some tweaking, eventually including features like reticulation of equivalent paths and a GUI to help construct these networks.
There were two problems, however:
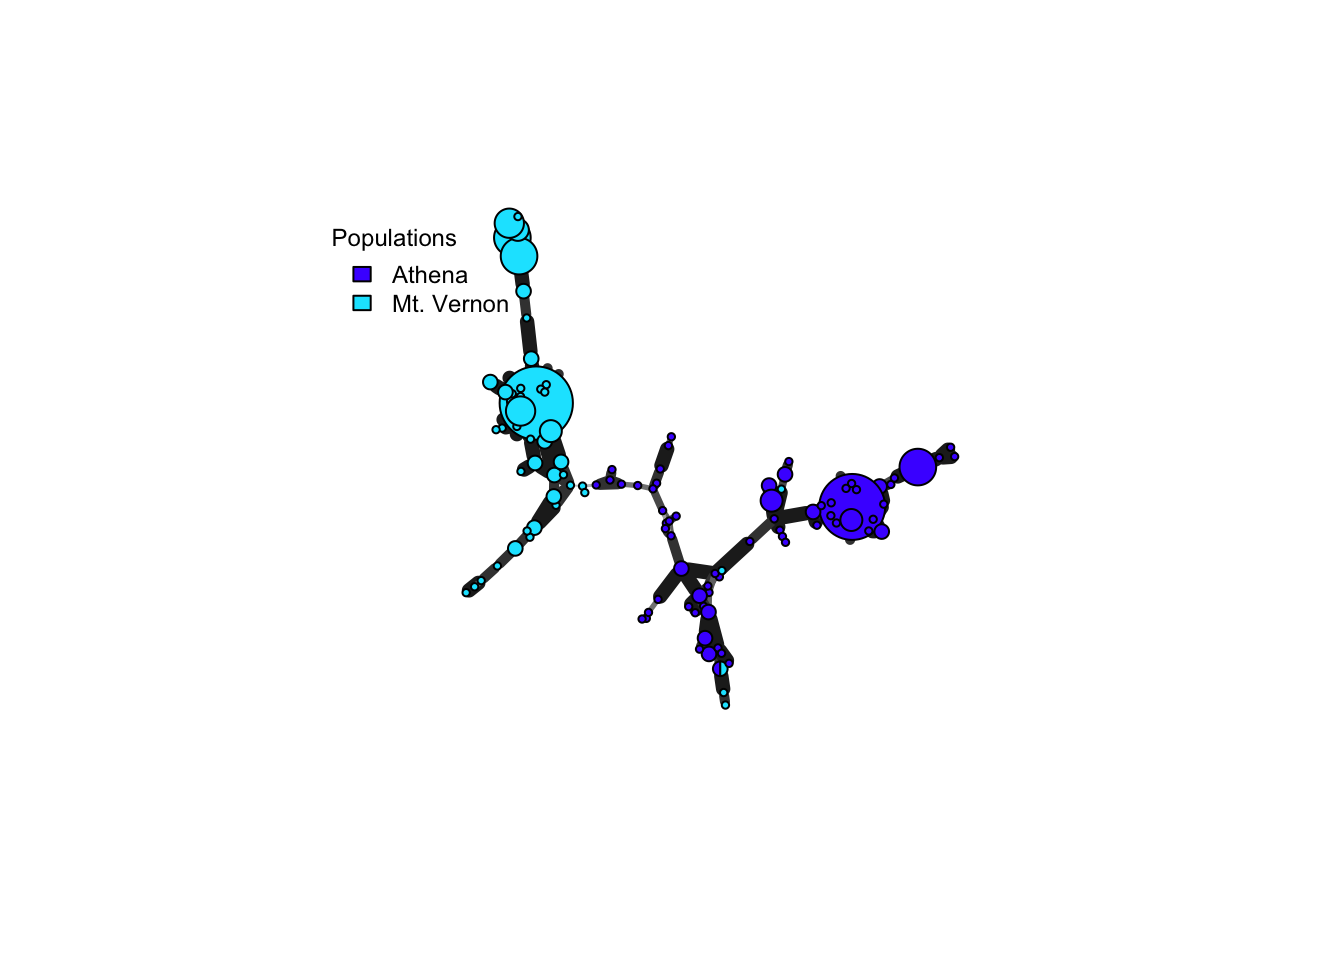
- Nodes were scaled by radius instead of area
- There was no legend for node sizes
Plotting by radius was especially problematic because they exaggerate differences between groups. Here’s an example of a network that was plotted with the previous version of poppr:
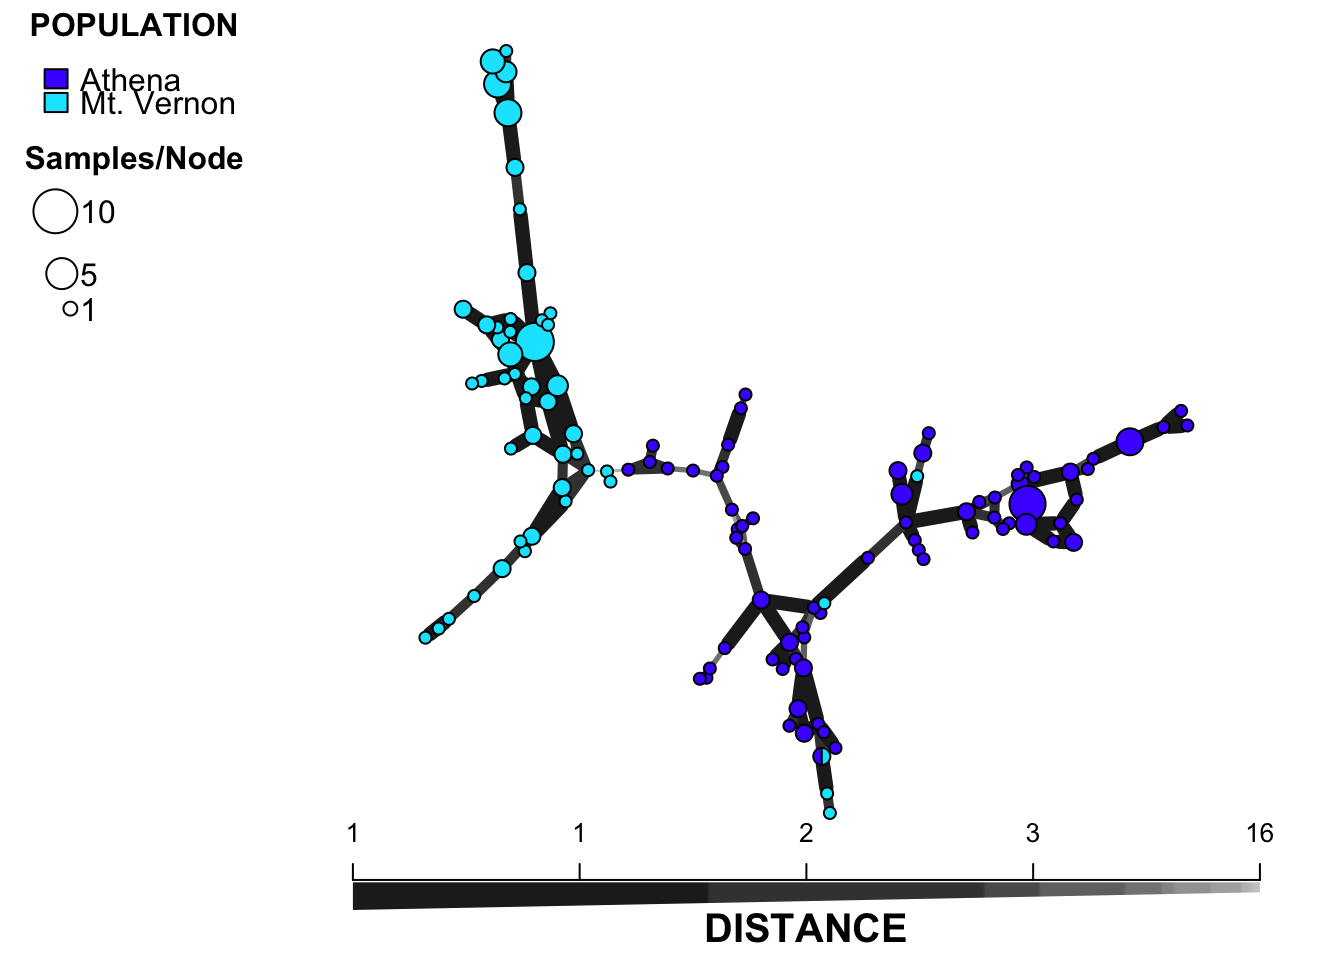
And here’s that same network plotted with the current version:
library("poppr")
data(Aeut)

# Basic plot
set.seed(2018-01-08)
amsn <- poppr.msn(Aeut, diss.dist(Aeut), include.ties = TRUE)
# with scale bar
set.seed(2018-01-08)
plot_poppr_msn(Aeut,
               amsn,
               inds = "none", # don't show any labels
               nodelab = 100 # don't label the sizes of nodes
               )
- Posted on:
- January 11, 2018
- Length:
- 1 minute read, 199 words